Artikel DJKN

Clustering Analysis for Property Valuation: From Complex Unlabeled Data to Brightly Lit Information
Aditya Rahmat
Selasa, 26 November 2024 pukul 14:22:09 |
1568 kali
Clustering Analysis for Property Valuation:
From Complex Unlabeled Data to Brightly
Lit Information
Written by Helvita Dorojatun
(Valuer and Data Analytic Enthusiast)
Introduction
How to make smart decision when you are faced
with a huge of multi-variable data? Understanding the details of each data
certainly allows us to make an accurate decision but time constraints are
always there. Systematic steps are necessary for extracting useful information
and knowledge from data. One of the systematic procedures that can be taken is using
Clustering algorithm. In this article, we will propose Clustering Algorithms
as an alternative to improve the quality and quantity of the valuer's work.
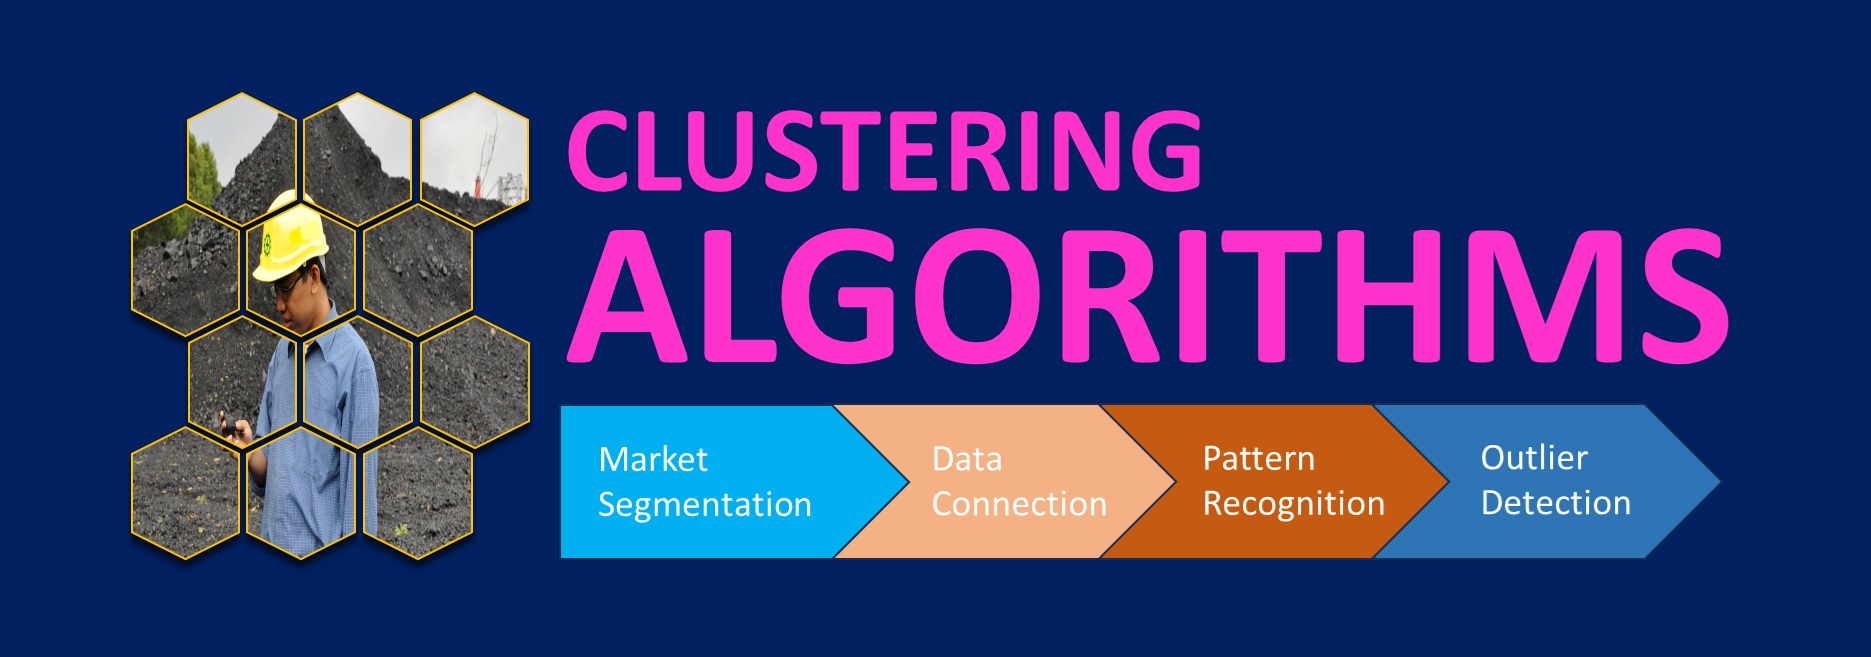
Clustering is an unsupervised learning technique that
perform the process of grouping similar objects or the partitioning of a data
set into subsets. Clustering algorithms can
analyze data sets with numerical or categorical variables. Some examples of using the clustering algorithms are determining the
right specific customer, Zoning, Property market segmentation, determining
patterns in real estate, and recognizing pattern in unprepared data.
There
are four types of clustering algorithms:
1. Partition based clustering for divide a set of data
into a number of clusters
2. Hierarchical clustering to determine the close
relationship between data
3. Density Based Clustering to find out the main patterns
from data that is full noise
4. And the last but not the least is model based
clustering which is an exploratory algorithm that has many variations and still
continues to develop.
Why Clustering Algorithm is
Relevant in Valuation Process?
Valuation
can be described as procedure of developing objective and unbiased opinion
about the value of an asset. This process is carried out by comparing the
subject property with comparable properties. The closer between the subject and
the comparable data, the more reliable the value will be. The clustering
algorithm is a method commonly used by researchers to group database on close
connectivity.
The clustering algorithm was developed from an ancient formula for measuring the shortest distance between two points. Euclidean distance is calculated as the square root of the sum of the squared difference between latitude and longitude components in two vectors. This formula was growing to measure more than two attributes in the data. The way this algorithm works is applicable to the property valuation process which uses a lot of proximity to quantify the influence of a variable. The use of mathematical formulas in this method makes the clustering algorithm work objectively. This will certainly ensure consistency and accountability in the process of property valuation.
Application of data mining in property valuation is becoming mandatory as data production increases. The Ideal data in the property valuation at least consists of several comparables, identical property attribute, up to date information, verified outcome from fair market value, and data from active market transaction. The expectation of this ideal data will be faced with a several challenges, namely: the imperfect of real estate market, the availability of data in less active market and the significantly different between the available data and the valuation subject (see RICS:2019). Data identification and collection are now getting faster and cheaper as access to data increases, so that currently the valuation process emphasizes more on data analysis. This fact ultimately encourages valuer to expand knowledge base in managing data efficiently (see: Appraisal Institute 2020; 81).
How Does Clustering Algorithm Work?
The first and most widely used Partition-Based Clustering algorithm is K Means. This algorithm forms data groups based on the proximity between the data and the cluster centeroid points obtained through an iterative process. This algorithm will form smaller distance within cluster members than distance between clusters. An explanation of the K-means clustering algorithm is presented in the figure below.

How Clustering
Algorithms Can Address Challenges in Property Valuation Data?
Property
valuation data in general has several uniqueness, namely it is mixed with
outliers, has attributes in categorical form and has different units or scale
forms. This condition can be overcome by modifying some mathematical equations.
Outliers on a
dataset have an impact on the results of clustering in K mean. When the centeroid
in K Means is determined by the average of the cluster members, the question
arises, what if there is an outlier in the cluster members? The outliers will
pull the average to the right or left of the pool actual data set. This
condition initiates K Medoids and K Median approach are born.
The
K-medoids algorithm uses the actual value that has the smallest dissimilarity
to all other objects in the cluster. While in the K Median, centeroid is
selected from the median data (mid points). K Medoids and K Median are designed
to be more robust outliers in the data or large range data (high variability).
Are categorical
attributes a problem for data mining? We often have property data
attributes in categorical form. In general, this
can be solved by transforming the form of data into a numerical. This procedure can produce biased conclusions
as the centeroid in K Means will be determined based on the average value of
the cluster members.
Allowing
data attributes in categorical form and processing them directly becomes an
alternative. The clustering algorithm
used to extract categorical data is K Mode. This algorithm uses the
value that appears most frequent value in a set of data (Mode) as a centeroid. Basically,
modifying the way the centeroid calculates will result in a compromise zone
between the analysis we want and the data we have.
Data analytics
enthusiast frequently must deal with data that has a very varied measurement
scale. The difference in scale greatly affects the results. Then what
treatments can be done to obtain unbiased results? Normalization and
standardization are one of the steps that can be taken to produce the best data
processing (see: Dorojatun, 2022).
How Many Clusters
of Property Data Are Optimal?
The
number of Clusters can be determined by an analyst who is well aware of the
required number of data classes (e.g., zoning, market type). However,
mathematically, the number of data clusters can be determined using several
approaches. Some of the approaches discussed in this article are Silhouette
Score and Davis Boudin Indexes
The
scale of silhouette score has a range of between -1 and 1. Silhouette score near +1 indicate that distance
between clusters is far away. Score 0 indicates that the distance between two
neighboring clusters very close (class overlap problem) or the cluster member has
the possibility assigned to the wrong cluster. So, the most optimal cluster is the
cluster with the highest Silhouette score.
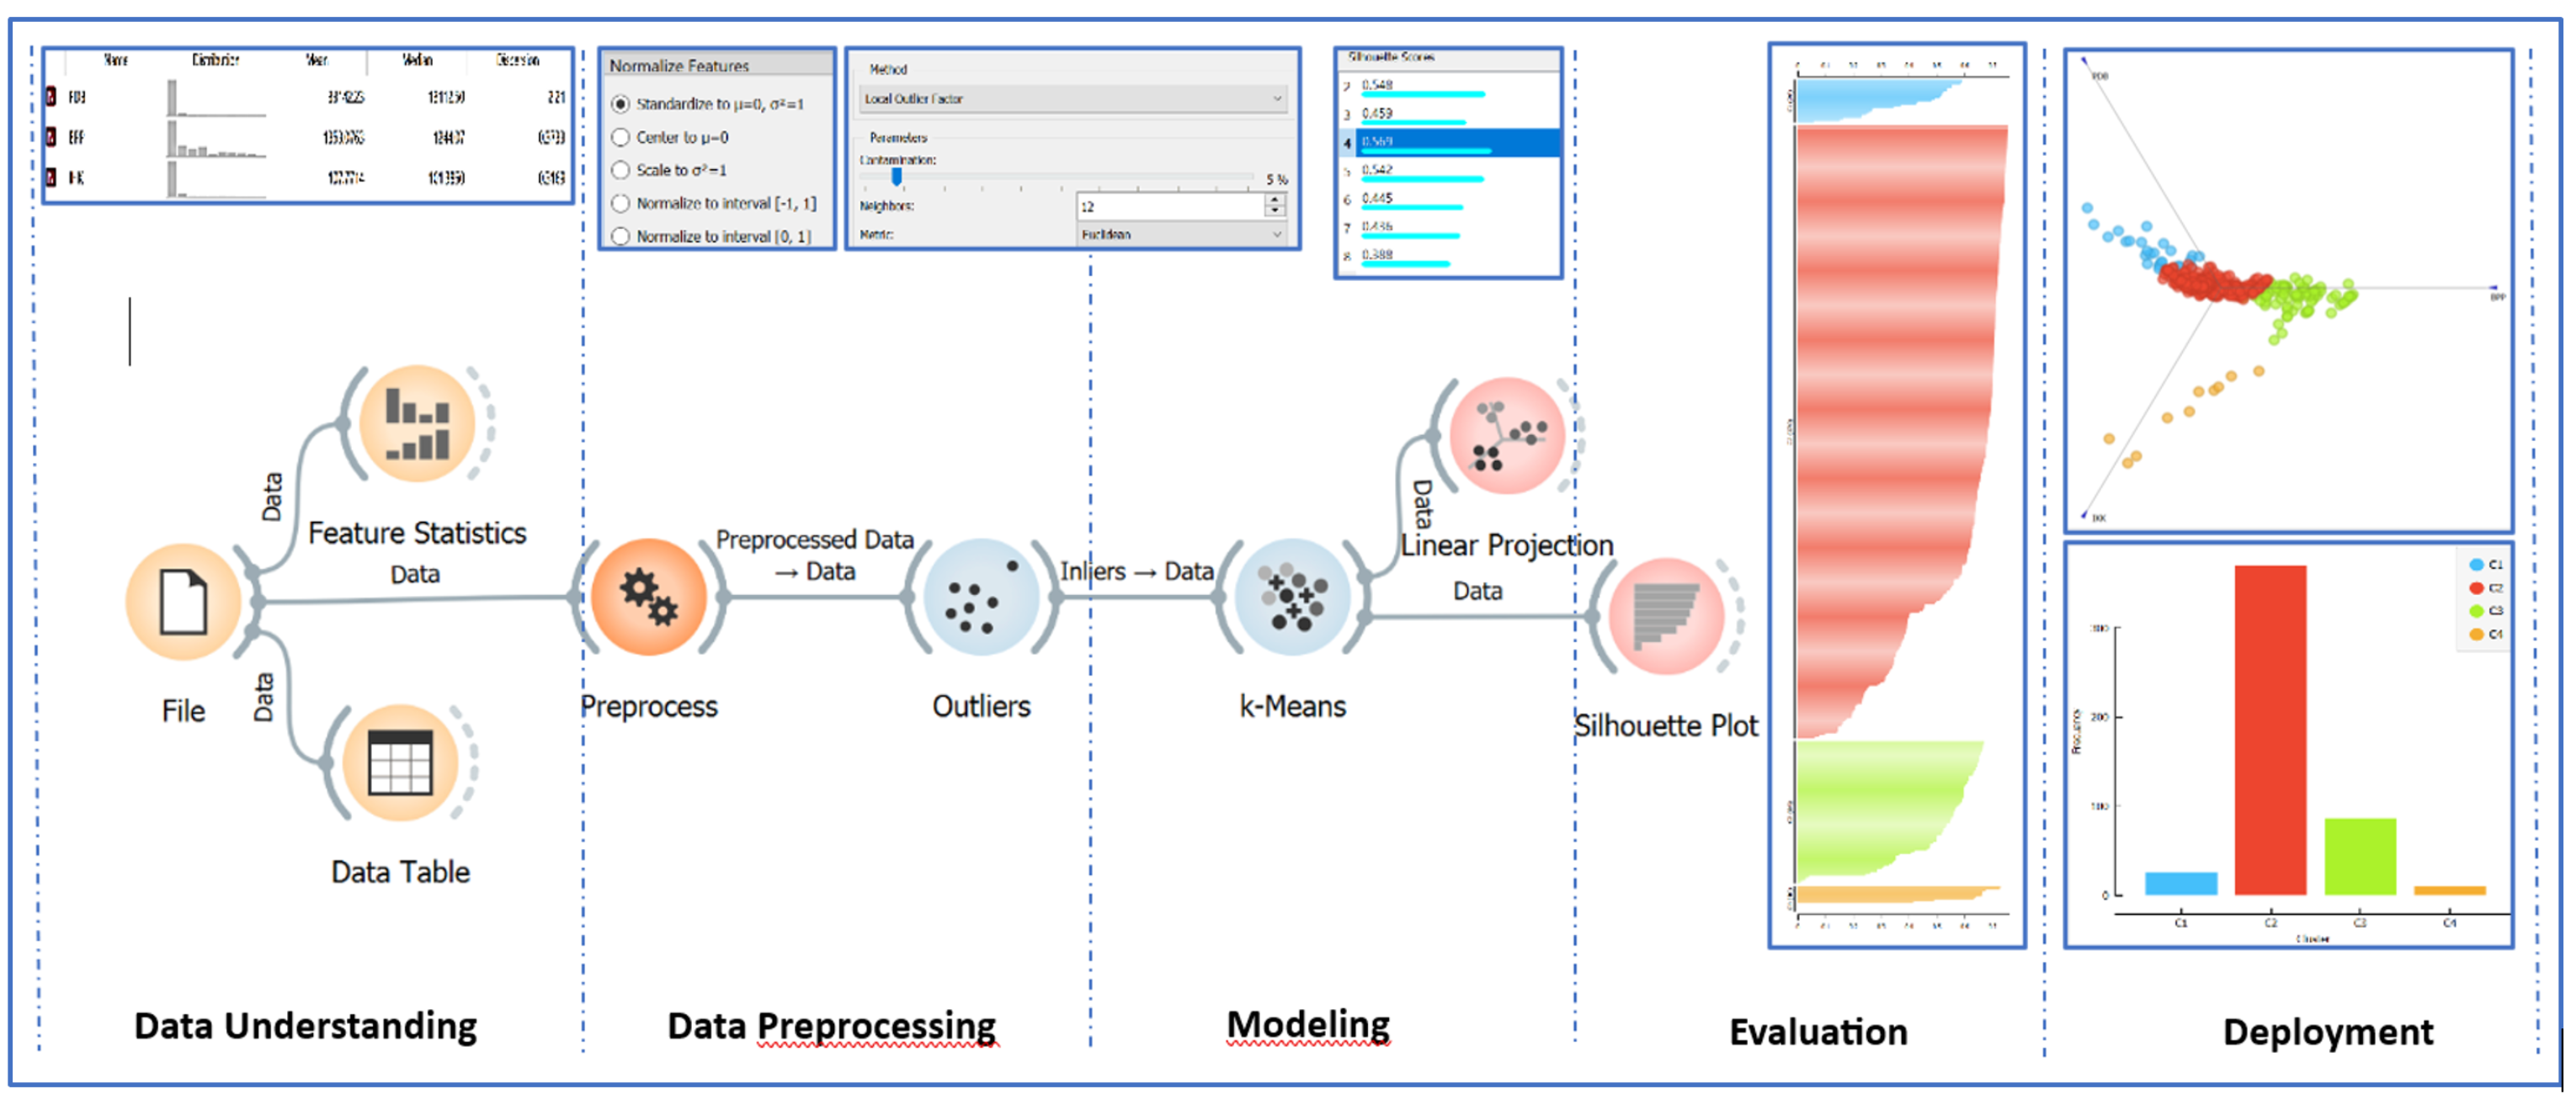
Determining the number of clusters is done using Davies Boudin index. The most recommended cluster is the cluster with the smallest DBI value. However, when this technique shows a linear downward trend in DBI scores with increasing cluster numbers, analysts combine it with the Elbow method. Stages of Clustering Algorithm by orange data mining platform is presented in the figure below.
Implementation of
Cluster Analysis in Property Valuation
1. Segmentation
Market
segmentation is one of the two questions that must be answered in market
analysis. In property valuation
context, valuer can define properties in several segments to obtain information
on where demand is coming from and where competitors are from based on its
characteristics (see: The Appraisal Institute, 2020). To support the accuracy
of value, the comparable data and the property being valued must be in the same
market segment. Property markets can be segmented by clustering algorithm with
using demographic variables such as age, education level, salary, family size,
gender, race, and marital status.
2. Comparable Data Evaluation
Determining
the best three of comparable data. In the sales comparison approach, Value
indication is generated from the process of adjusting the difference between the
comparable and subject properties. The most credible indication of market value
of an asset is in line when the difference with the comparable is very close. The Clustering Algorithm mathematically and
consistently will show the comparable data that has the most identical
attribute to the subject being valued. The Clustering algorithm will work very
well especially when the comparison variable is quantified in proximity. For
example, the valuation for residential property is affected by the proximity to
public transportation, proximity to open space and parks, proximity to arterial
roads, etc.
3. Pattern Recognition
Transaction pattern studies often must be done by valuers
in huge of data with multi variables and multi categories. Clustering can
provide this information, as well as show where you stand among comparable
data. An example of the benefits of pattern recognition is to determine zoning in
comparable data for property valuation.
Conclusion
Clustering is a
data mining technique that tells us how far and close the relationship between
data is through mathematical equations. Through modifications to the centeroid
determination method, this algorithm continues to evolve to find the form that
best fits the analysis we want. Through this method, valuer can work
systematically and efficiently to improve the accuracy of the valuation results.
Reference:
Appraisal
Institute. (2020). The Appraisal of Real Estate (15th ed.). Chicago,
ISBN 9781935328780
Dorojatun, H. (2022). Seri Artikel
DDDM KPKNL Mamuju: Normalisasi dan Standardisasi dalam Data Mining.
Retrieved from
https://www.djkn.kemenkeu.go.id/artikel/baca/15943/Seri-Artikel-DDDM-KPKNL-Mamuju-Normalisasi-dan-Standardisasi-dalam-Data-Mining.html.
RICS. (2019, October). Comparable evidence in real estate valuation, RICS professional standards and guidance (1st ed.). ISBN 978 1 78321 373 3
(
| Disclaimer |
|---|
| Tulisan ini adalah pendapat pribadi dan tidak mencerminkan kebijakan institusi di mana penulis bekerja. |